Infographics take information or data and present it in a visually pleasing way. Although infographics are not new (some suggest that cave paintings were the first infographics!), they have taken on a new life with visual social media sites like Pinterest or Tumblr.
Infographics can be simple or complex. The key is to communicate your message quickly and with style. Producing a complex and unique image requires some graphic design skills, but if you are looking for something simple and fun, there are free tools that anyone can use.
Notable Quotes
To turn a quote into a work of art, we recommend Pinwords.


Pinwords is an easy-to-use tool that enables you to place words over an image that you upload.
If you don’t have your own image, you can use one of the Pinwords default backgrounds. You can share the resulting graphic on Pinterest, Tumblr, or Facebook.
Use Your Words
Infographics are often packed with statistics, but they don’t have to be.

One of the easiest ways to create an infographic is Wordle, which generates “word clouds” from text you supply. (The most frequently used words are the largest.)
This Wordle was created from last month’s Random Notes article on social media analytics.
Got Data?
If you have data, you can do a number of interesting things. One of the most flexible tools is Many Eyes from IBM.

You can upload your own data (here I’ve uploaded the Random House Twitter accounts and their followers), and then choose from a whole range of visualization tools (bar charts, histograms, bubble charts, scatterplots, pie charts, network diagrams, and more). Uploaded text can be analyzed as a word cloud, word tree, or phrase net. There are also mapping tools for geographic data. Bear in mind that the data you upload and the resulting infographic will be public.
Neither Wordle nor Many Eyes allow you to download your image. You will need to either embed the link, or take a screenshot and crop it using Paint or Photoshop.
For creating interactive maps, it’s hard to beat StatSilk.

Their StatPlanet interactive mapping software is used by NGOs and large corporations, but the simplest version is available for free. They also have over 300 interesting maps already uploaded that you can share.
Creately focuses on the easy creation of diagrams, mostly aimed at business and IT people. Examples include flowcharts, organization charts, mind maps, and Venn diagrams.

Although it’s quite a serious site, it’s not hard to also see the fun possibilities (see above).
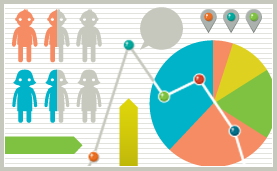
For a full infographic experience, you might want to take a look at Piktochart.

This Malaysia-based start-up provides more complex infographic templates that you can customize with your own information. Their free option allows you to choose from three basic themes, including the one pictured. Their paid options give you a wider choice of themes and image uploads.
And finally, Visual.ly has a free service that will enable you to create a fun infographic from your Twitter or Facebook stats, with more tools in the works. They have a huge selection of professionally produced infographics on a whole range of topics.
Inspiration Without Perspiration
If all else fails . . . share! Here are some of our favorite not-so-simple book-related infographics on the web which you can use, share, or simply take as inspiration.


More Resources
For more information and ideas on creating and using infographics, we suggest the following:
• Two great blogs that solely focus on infographics: Datavisualization and ByJess (from Visual.ly founder Jess Bachman)
• Two fun articles from The Next Web blog and data visualization expert Sara Slobin
• A Pinterest board full of Mashable infographics
By Sophie McNeill, Digital Channel Development